

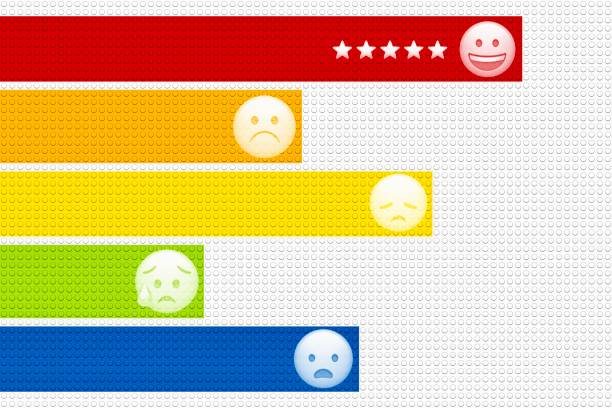
In the digital marketplace, customer reviews have become a critical source of insight, shaping purchasing decisions and business strategies.To effectively harness this wealth of unstructured data, businesses and analysts rely on sentiment analysis.
The standard Google Search Console Mobile Usability report is a blunt instrument, and you already know that. It flags clear structural violations—clickable elements too close, content wider than screen, text too small, viewport not configured. These are the low-hanging fruit, the validation-layer errors that any grade-B validator could catch. But if you have been in the trenches for at least a year, you have likely experienced the far more frustrating diagnostic reality: a page that passes every single Mobile Usability check with a pristine green checkmark, yet bleeds organic traffic from mobile users at an alarming rate. The conversion rate sinks. The bounce rate for mobile sessions climbs. And Search Console offers you nothing but silence. This is the GSC void, and it is where intermediate web marketers must learn to operate if they want to differentiate their work from basic compliance scrubbing.
The most insidious mobile usability issues are not errors in the strictest sense but friction points embedded in interaction design and rendering performance. Google’s crawler does not swipe, tap, or scroll with human intent. It snapshots a DOM state at render time and evaluates spatial relationships between elements. It does not assess whether a floating sticky footer causes accidental clicks on the wrong product variant when a user tries to scroll past it. It does not measure the cognitive load of a custom dropdown menu that collapses too quickly when a thumb hovers near the edge of the viewport. These are the silent killers. To diagnose them, you must pivot from using Search Console as an error log and start using it as a behavioral beacon.
Begin with the Core Web Vitals report, but do not stop at the aggregate LCP, FID, or CLS thresholds. Drill into the individual page URLs within the Mobile category, specifically those flagged as “Needs Improvement” or “Poor.” Now cross-reference those URLs with the Mobile Usability report; you will frequently find pages that have zero listed mobile usability errors but sit in an abysmal LCP or CLS bucket. This is your first clue. A cumulative layout shift score of 0.35 or higher on mobile almost never stems from a single, obvious structural misconfiguration that the crawler can flag. It stems from late-loading dynamic content—an unpinned hero image, a deferred font causing FOIT, a third-party embed that resizes after the viewport is already painted. The Mobile Usability report tells you the page is laid out correctly in the static snapshot. The Core Web Vitals report tells you the page is unstable in the dynamic experience. The gap between those two datasets is your diagnostic playbook.
Go deeper still. Use the Performance report filter to isolate mobile queries only, then sort by average position and click-through rate for pages that rank between positions 1 and 5. Identify any page that has a high impression count but a disproportionate dip in CTR compared to desktop. This pattern is a classic signature of mobile usability interference that bot detection cannot see. A user sees the snippet, taps the result, arrives at your page, and faces something that compels them to back out before the page fully registers the navigation. The most common culprit here is the intermodal overlay—a newsletter pop-up, a cookie consent wall, or an app-install banner that fires immediately on mobile. Search Console will not flag the overlay itself unless it violates the interstitial guidelines, and even then, the penalty is typically manual and rare. But diagnostic data from the CTR vs. top-rank gap screams that something is intercepting the user’s first impression. You have to confirm it yourself: load the URL on an actual device with a throttled network, no browser extensions, and look for any element that consumes more than 20 percent of the viewport upon entry. If you see it, you have found a friction source that no automated tool in Search Console ever labeled as an error.
Another diagnostic blind spot involves scroll hijacking and gesture interference. Google Search Console’s mobile usability criteria are largely static layout checks. They do not test for custom JavaScript that overrides native scroll behavior, nor do they detect touch event listeners that block the browser’s default pull-to-refresh functionality. Yet these are increasingly common enhancements that degrade the user experience severely. The diagnostic signal in Search Console is indirect: look at the “Pages” tab in the Core Web Vitals report and spot any mobile URL with a disproportionately high Total Blocking Time relative to its First Input Delay. High TBT on mobile is often a red flag for a heavyweight interaction script waiting for user input—like a gesture library that wraps the entire document body. The page passes all mobile usability checks, but the user feels lag every time they try to scroll or tap. The result is a slow-burn decline in average session duration and a gradual erosion of rankings as behavioral signals sour.
The enhancement side of this equation is not about fixing errors that Search Console can see. It is about proactively auditing the pages where Search Console sees nothing wrong but your analytics data screams that something is broken. Set up a custom search appearance report for “Pages with No Mobile Usability Errors but High Mobile Bounce Rate.” Every month, manually inspect the top ten such pages on an actual mobile device, not an emulator. Load them with slow 3G throttling, rotate the device, and simulate a real user task—find the product, fill the form, start the checkout. If any micro-interaction takes more than one tap or an unnatural finger stretch to complete, you have found an enhancement opportunity that will outperform any run-of-the-mill technical fix.
The most dangerous mobile usability issues are the ones that fly under Google’s detection radar because the DOM is correct and the viewport is compliant. Your job as an intermediate web marketer is to treat Search Console as the starting point for a deeper investigation, not the final verdict. The green checkmark is not a seal of approval; it is a reminder that the true friction lies in what the crawler cannot feel. Find those silent killers, and you will move from simply avoiding penalties to genuinely improving the mobile experience that drives your rankings.

In the digital marketplace, customer reviews have become a critical source of insight, shaping purchasing decisions and business strategies.To effectively harness this wealth of unstructured data, businesses and analysts rely on sentiment analysis.

Standard competitor backlink gap analysis often devolves into a naive comparison of domain rating vs.referring domains, a heuristic that ignores the most lucrative opportunities sitting in plain sight.

The days of treating keywords as isolated atomic units are behind us.Any web marketer who has spent a year or more in the trenches knows that ranking for a high-volume term means little if the searcher’s underlying need is misaligned with what your page delivers.
Get answers to your SEO questions.
